Public Dataset Profiling
Automatically infer a governed taxonomy from any QA dataset to understand coverage, balance, and structure.
The Problem
Public QA datasets usually arrive as flat lists of question–answer pairs, with little or no metadata. Before you can use them, you need to understand:
What topics dominate
Difficulty distribution
Reasoning types covered
Gaps or imbalances
Manual labeling does not scale, and ad-hoc clustering produces results that are hard to reuse, compare, or govern.
What qa-tools Produces
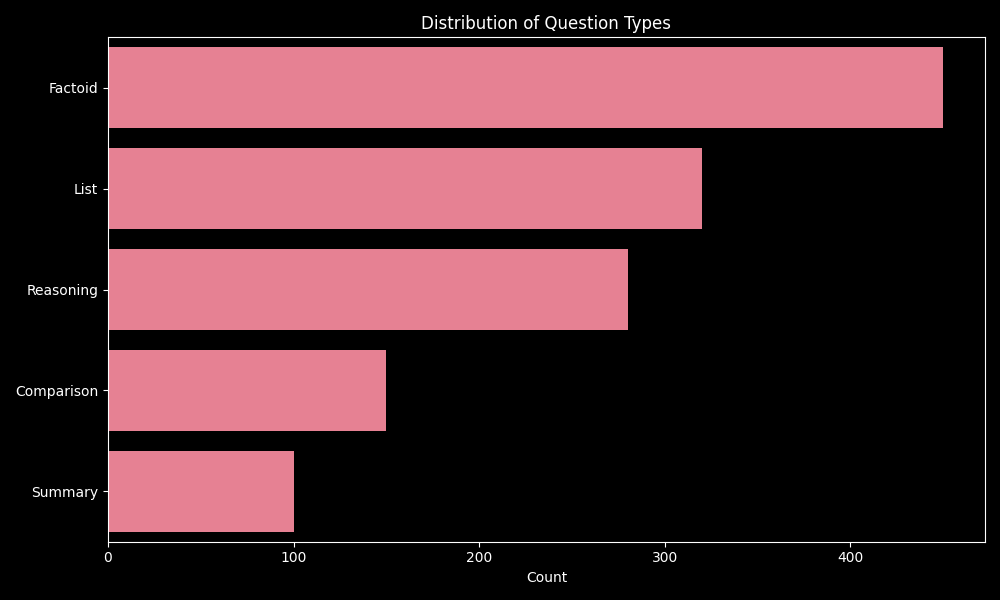
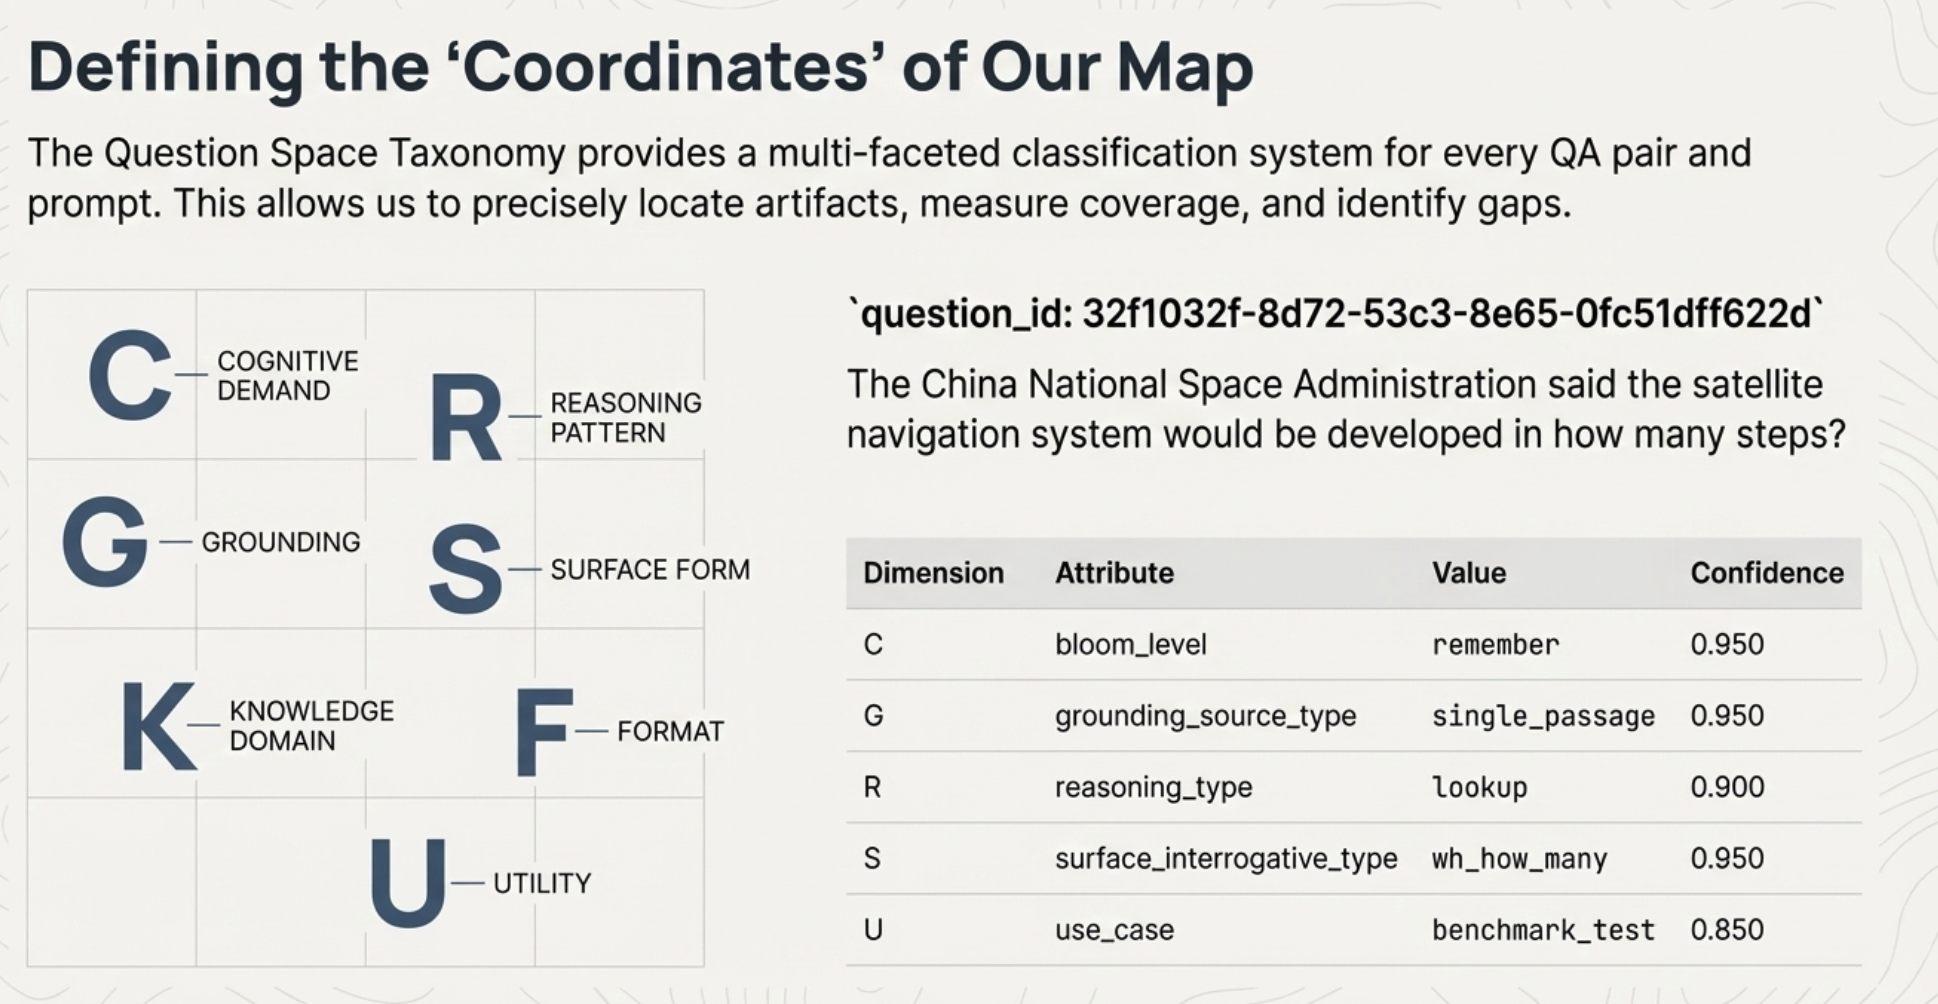
Per-question taxonomy labels
Topic, difficulty, reasoning type, interrogative form.
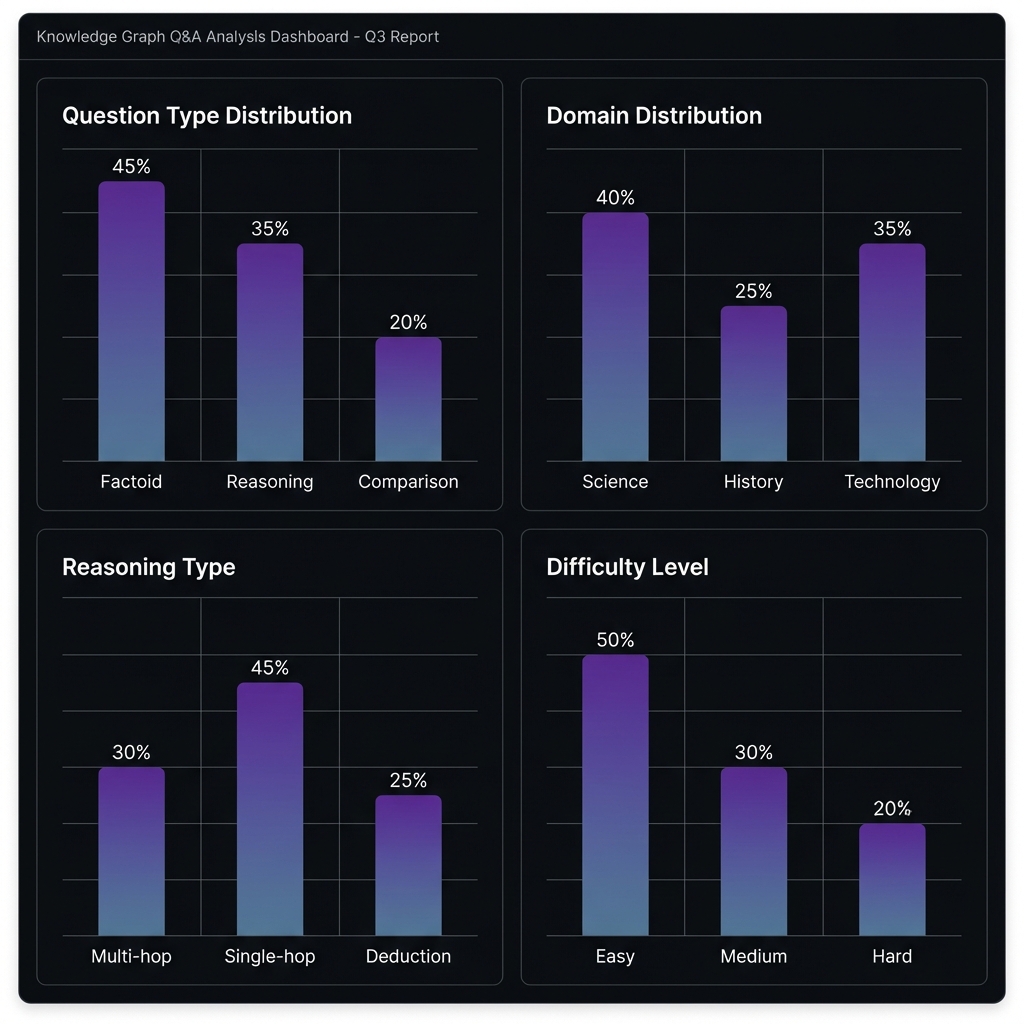
Dataset-level distributions
Aggregated summaries and statistics.
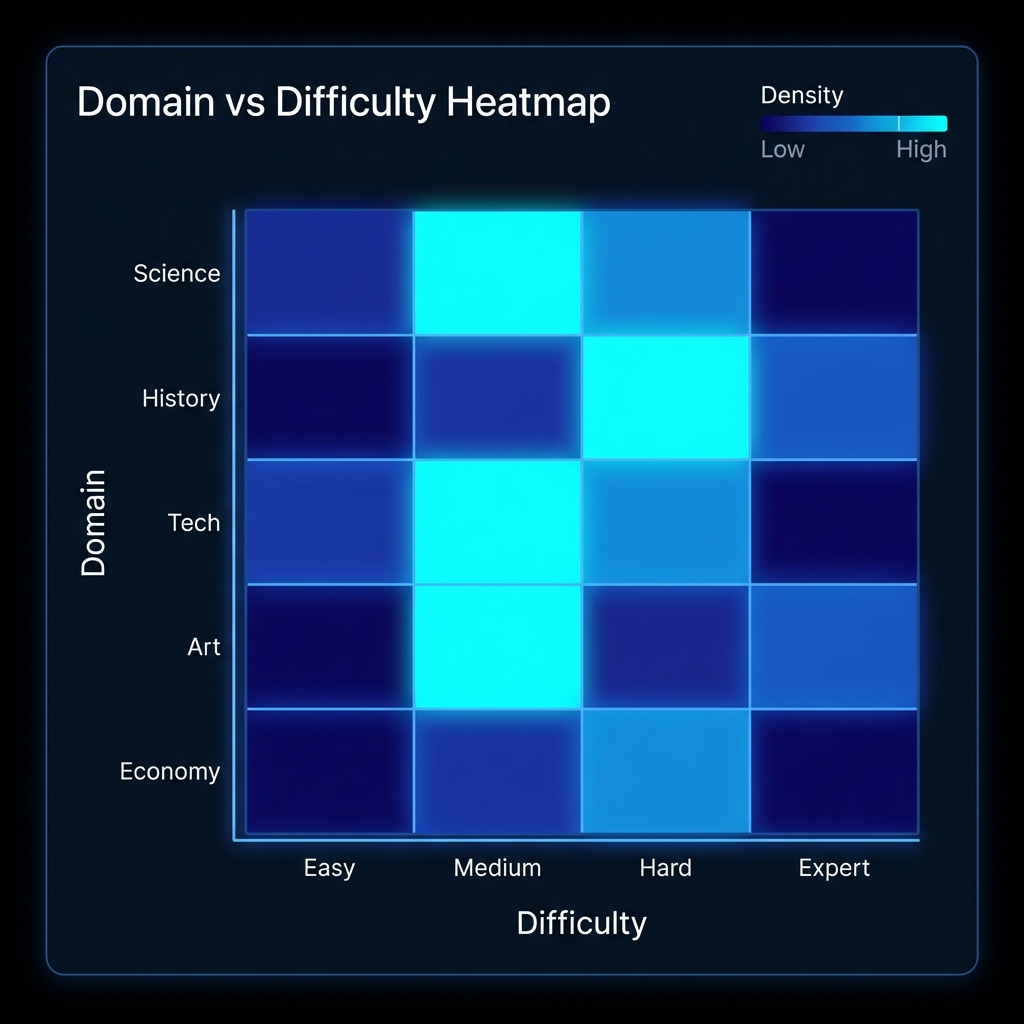
Cross-attribute views
E.g. topic × difficulty heatmaps.
Persisted metadata
Queryable and reusable downstream.
Visuals